Diagram as code means describing a diagram in a plain-text language and generating the picture from it, instead of drawing it by hand in a GUI. The diagram lives in your repository, changes in pull requests, and never drifts out of sync with the system it documents. This guide covers what it is, why it wins, the main tools, and how animation takes it further.
Why diagram as code?
- Versioned. Diagrams live in git next to the code, with a full history and readable diffs.
- Reviewable. A diagram change is a text change in a PR - not a re-exported binary image.
- Always current. Update the diagram in the same commit as the system.
- Automatable. Generate, lint, and render diagrams in CI; let AI agents draft and revise them.
- Portable. Plain text - no proprietary file format or per-seat license.
The main diagram-as-code tools
| Tool | Strength | Output |
|---|---|---|
| Mermaid | Ubiquitous; built into GitHub/GitLab | Static SVG |
| PlantUML | Comprehensive UML | Static image |
| D2 | Modern layouts, polished architecture diagrams | Static SVG |
| Graphviz | Graph layout primitives (DOT) | Static image |
| Markdy | Animation, narration, architecture vocabulary | Animated, seekable scene |
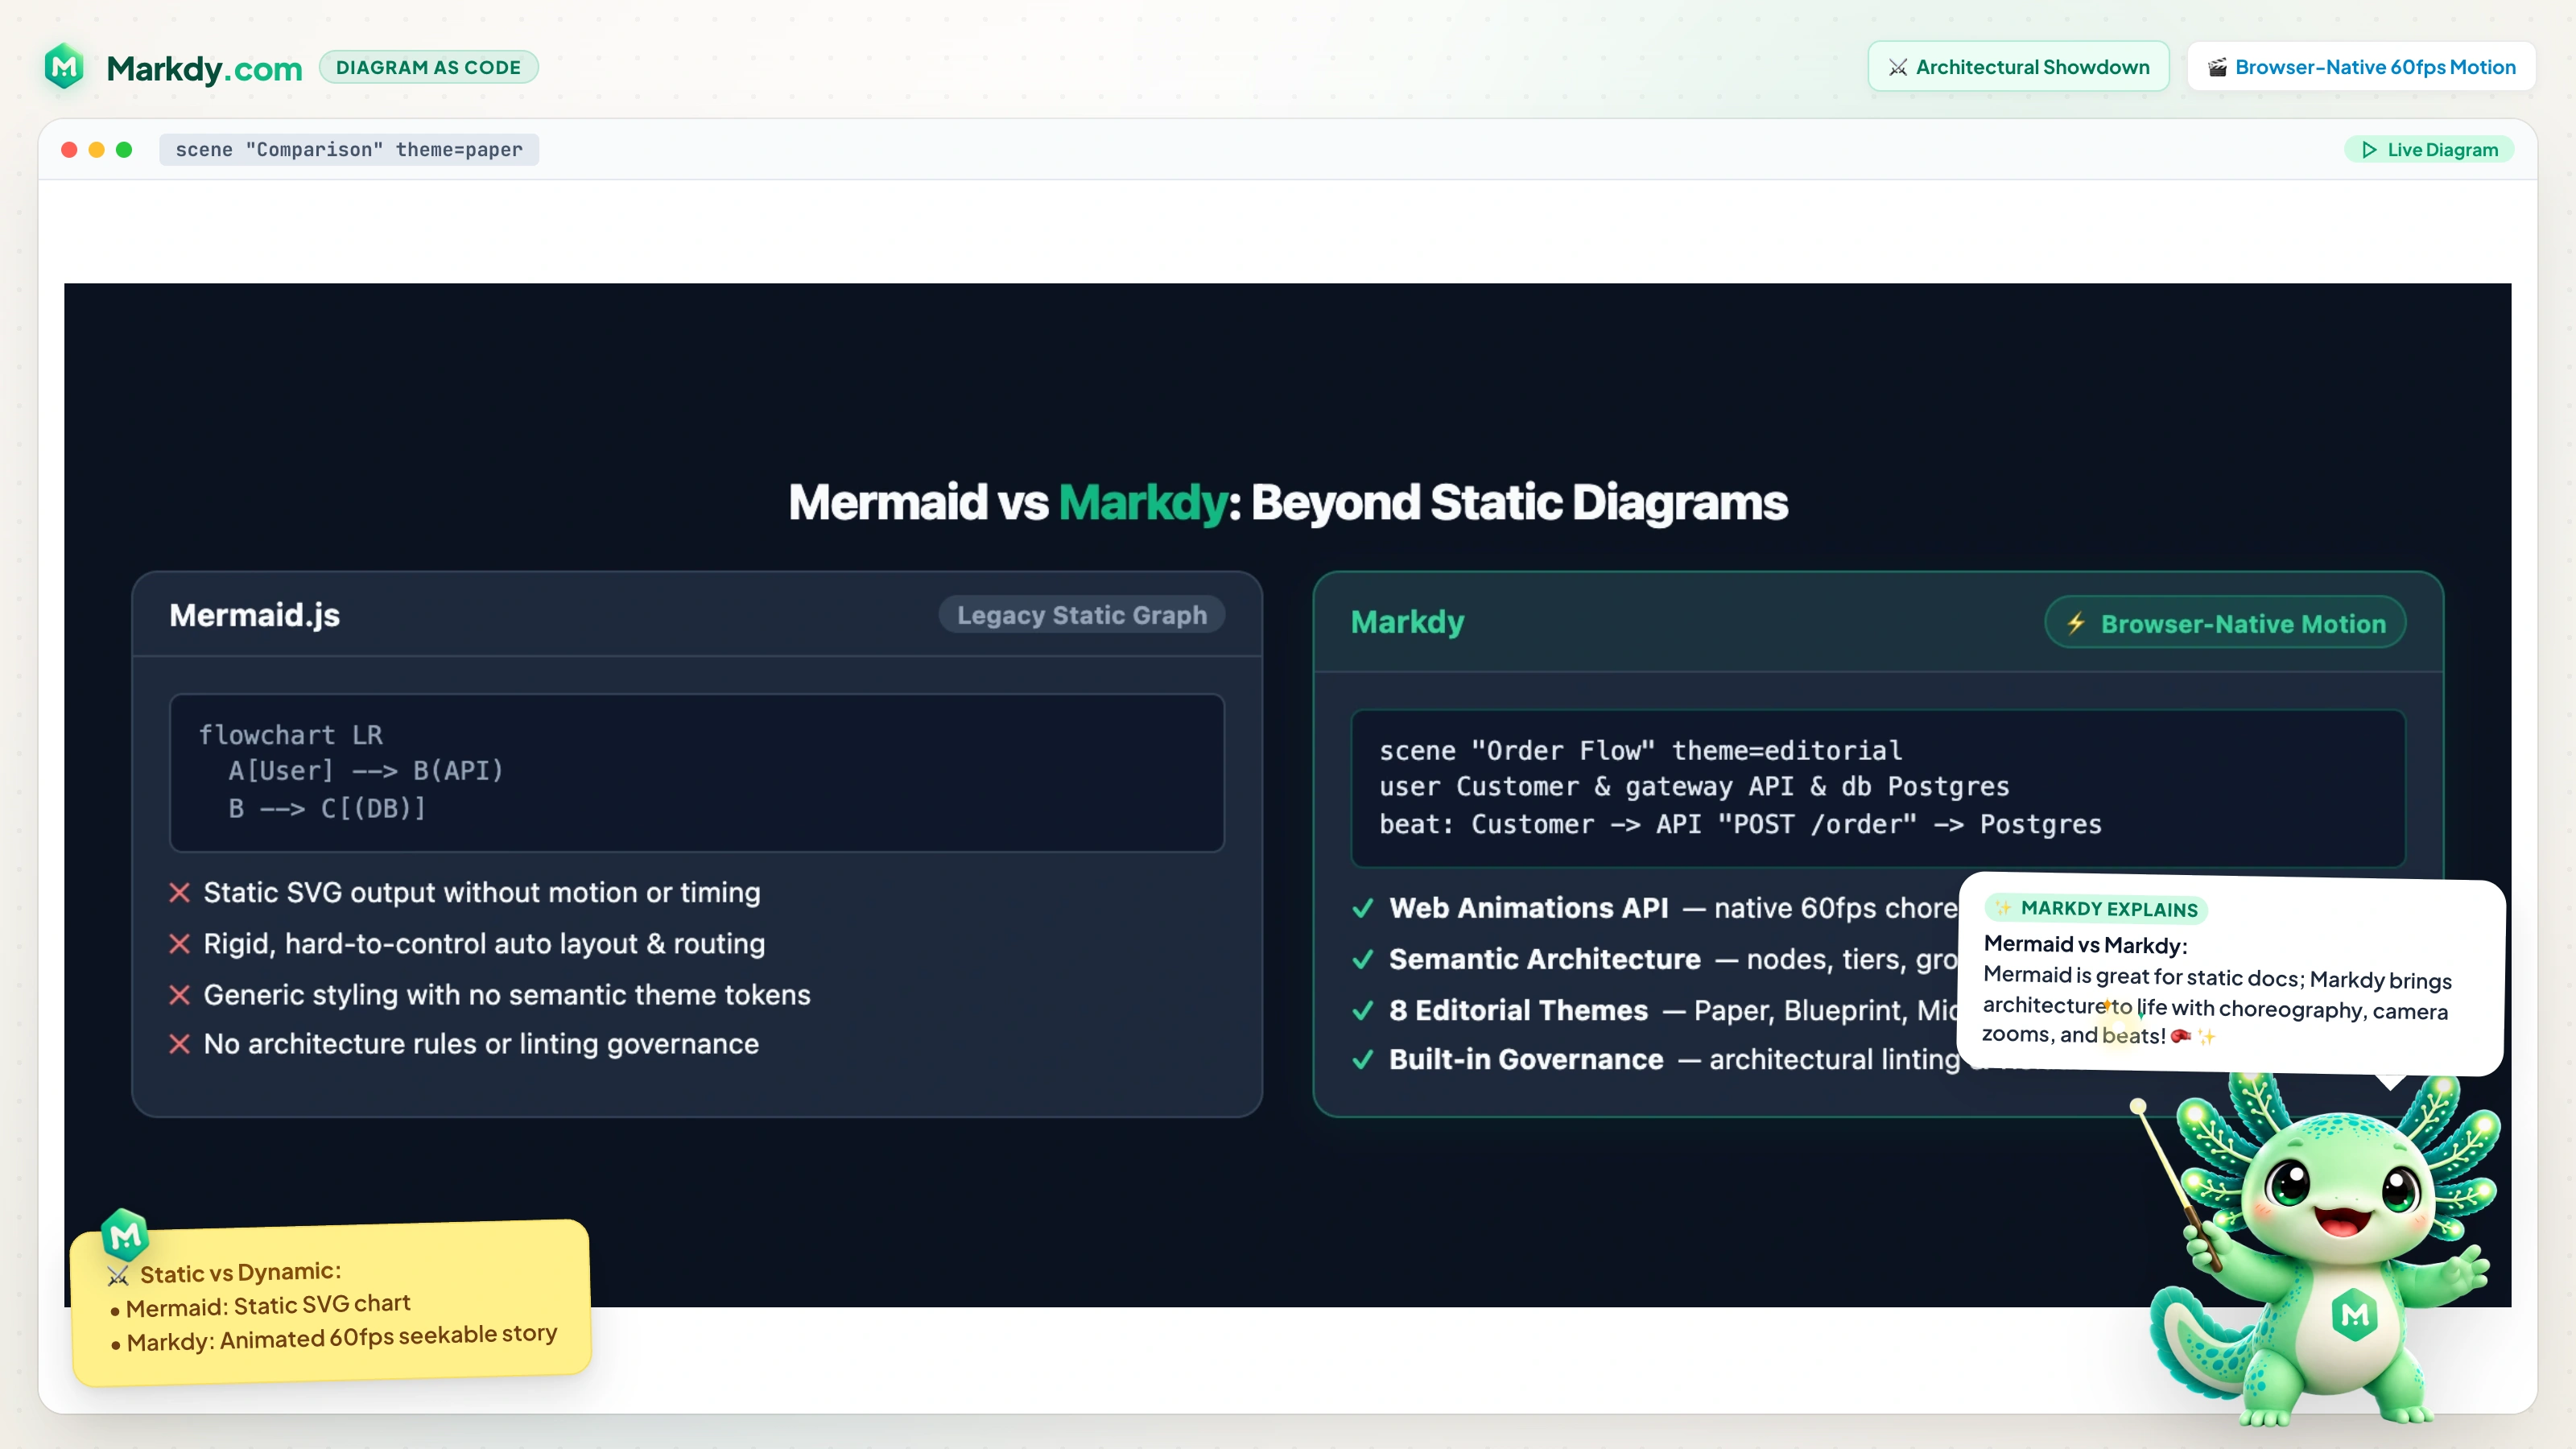
For static charts, Mermaid is the default for a reason. For a comparison focused on motion, seeMarkdy vs Mermaid andthe best Mermaid alternative.
The next step: animated diagrams as code
A static picture shows structure; an animated one shows behavior - the order of calls, the fan-out to a queue, the cache-miss fallback. Markdy adds motion to diagram as code using the browser-native Web Animations API, so the diagram plays in any page without Canvas, GSAP, or a video export.
scene "Cache-Aside Architecture" theme=paper
layout LR

browser Client "Web Client"
gateway Gateway "API Gateway"
service Shortener "URL Service"
cache Redis "Redis Cluster"
database Postgres "PostgreSQL 16"

beat hit "1. Sub-2ms Cache Hit Path":
  show $nodes stagger=60ms
  frame Client Gateway Shortener Redis zoom=1.1
  Client -> Gateway "GET /x9" -> Shortener "resolve"
  Shortener -> Redis "GET slug:x9"
  Shortener <- Redis "200 Target URL"
  Client <- Gateway "301 Redirect"

beat miss "2. Cache Miss Fallback & Async Warm":
  frame Shortener Redis Postgres zoom=1.15
  Shortener -> Postgres "SELECT destination WHERE slug = 'x9'"
  Shortener <- Postgres "Row Found"
  Shortener ~> Redis "SETEX slug:url (Warm Cache)"
  glow Postgres color=#38bdf8 & glow Redis color=#22c55e
The same source model supports focused compositions: use type=flowchart for decisions,type=tree for hierarchy, type=state for lifecycles, type=sequencefor ordered participant messages, or type=constellation for a radial signal map. Usetheme=editorial for docs or theme=nebula for a cosmic focal scene.
How to start
- Sketch a scene in the playground - no install.
- Learn the grammar in the docs or the agent guide.
- Commit the
.markdyfile and render it in your app, Astro, or MDX. - Lint diagrams in CI with
markdy lintso a broken diagram fails the build.